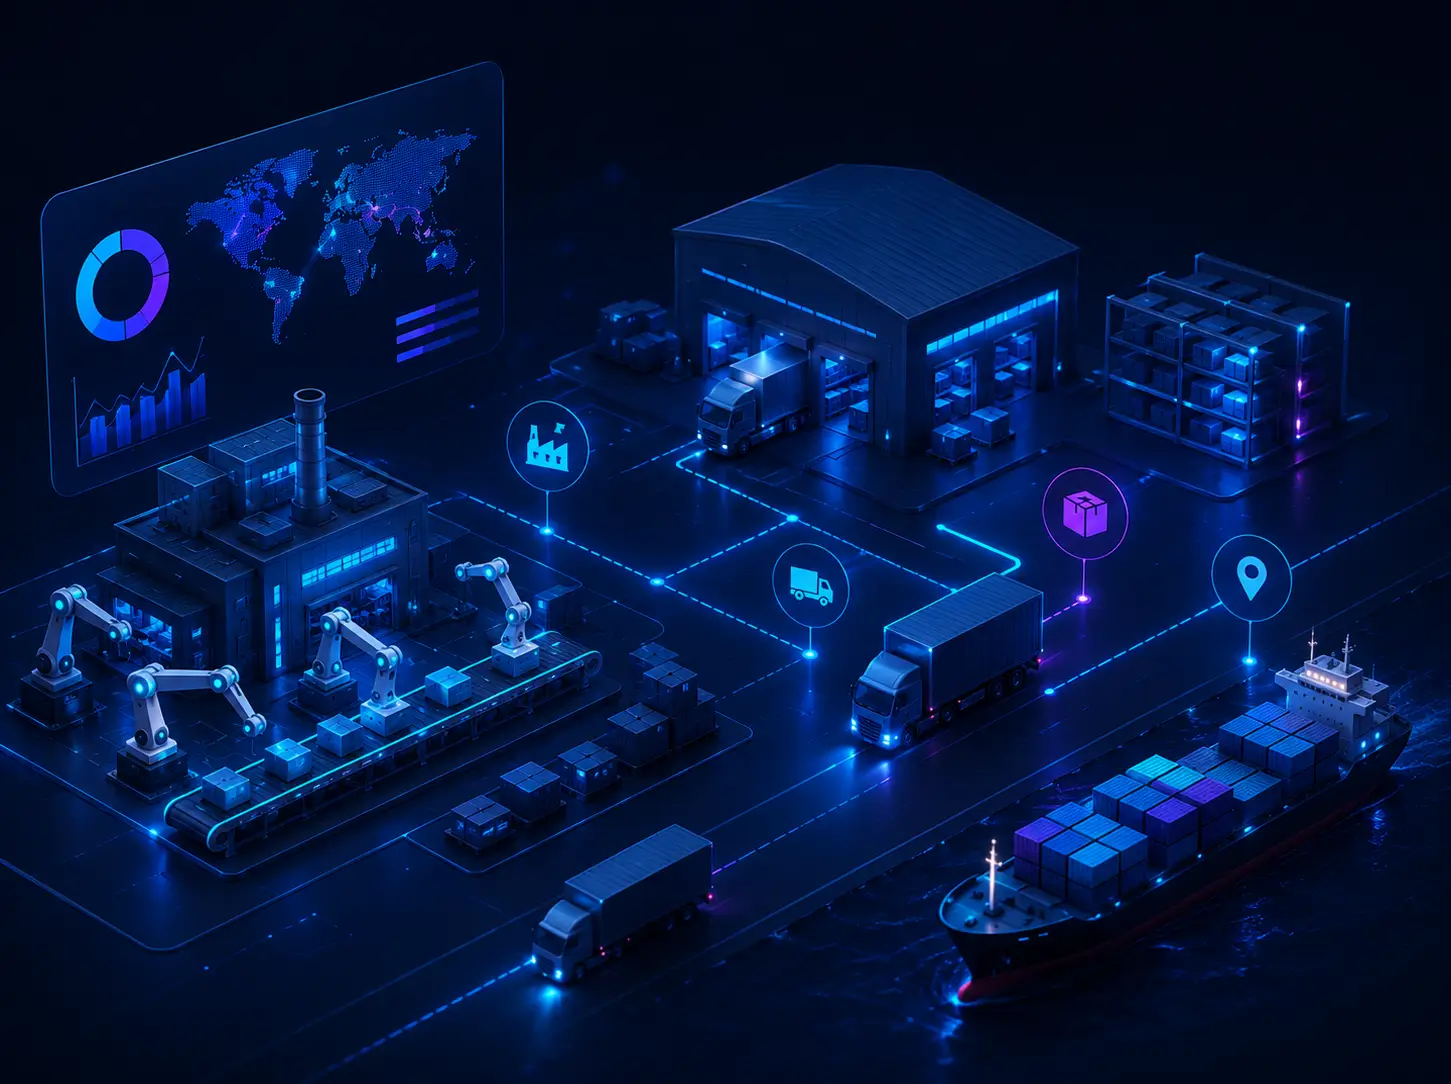
How Baril Coatings Accelerated Its Digital Transformation
Discover how Baril Coatings modernized operations with a cloud ERP, improved data visibility and supported sustainability goals with Prodware
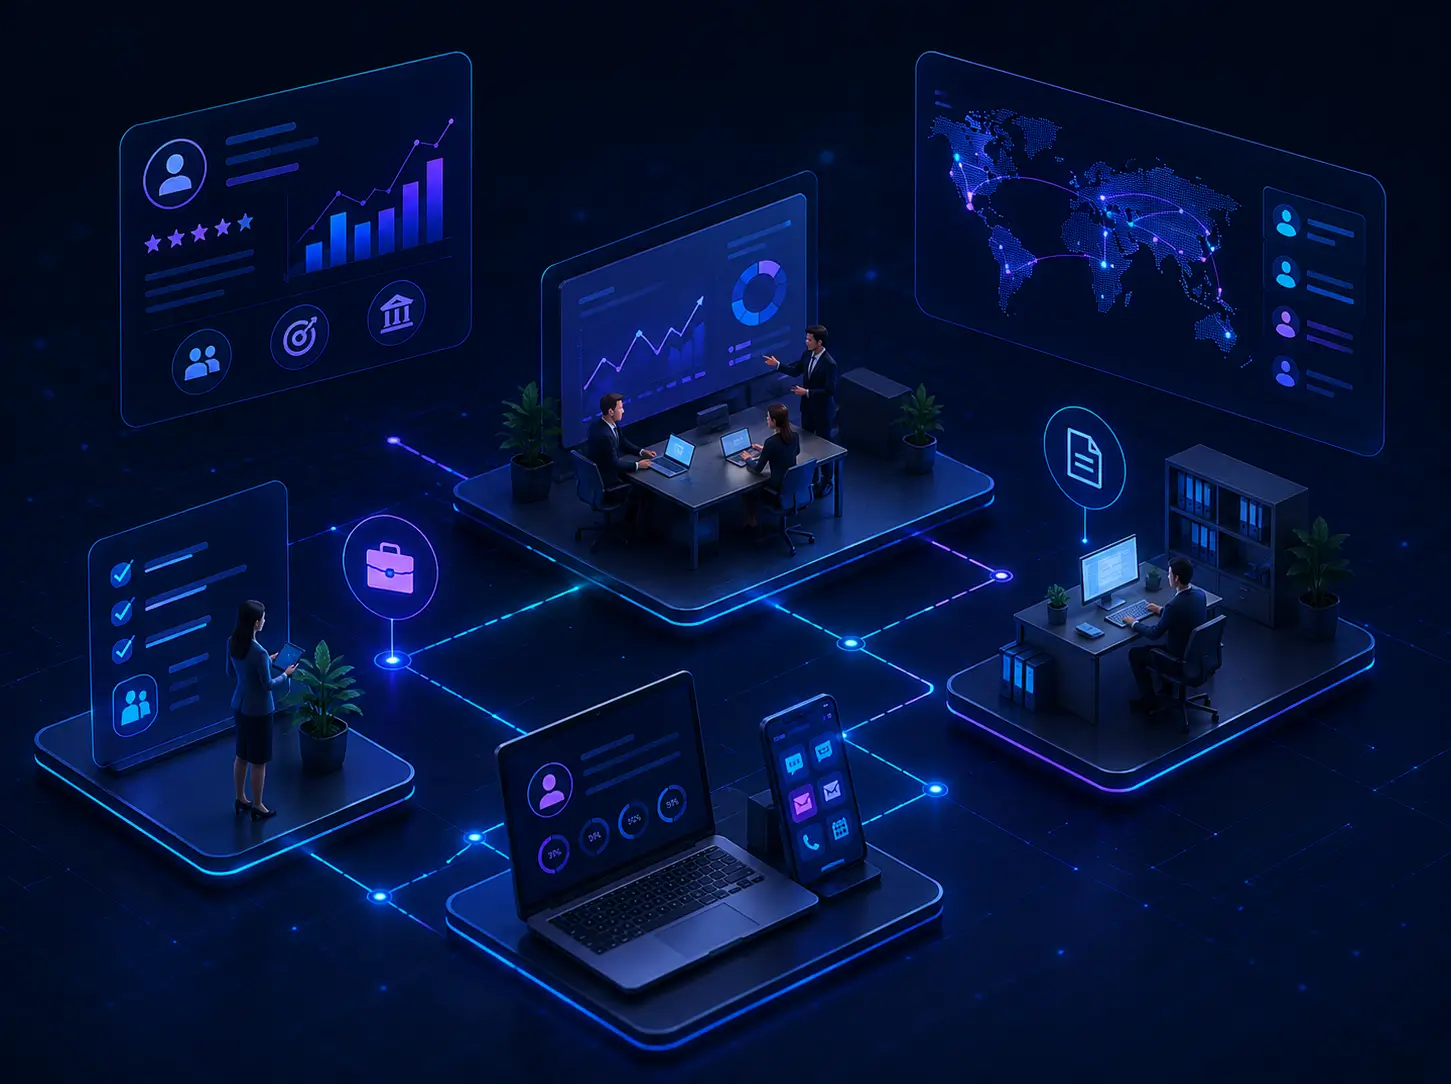
Turn data into clear, visual, and actionable business decisions
Business Intelligence turns data into clear, reliable insights that drive better decisions. By combining reporting, visualization, dashboards, and KPIs, it offers a unified view of performance across teams and leadership. It helps you understand current activity, track objectives, spot deviations early, and act with confidence. By structuring and standardizing information, it builds a strong foundation for performance management, advanced analytics, and future AI capabilities.
Our AI BI turns raw data into insights automates analysis, reveals patterns, speeds decisions, reduces manual work, uncovers opportunities
AI analyzes large data in real time, finds trends, anomalies & correlations, removes manual work, delivers current insights for decisions.
Context-aware platform uses historical data and predictive models to recommend actions, optimizations and next steps performance decisions.
Advanced AI forecasts future outcomes from past and current data, helping users anticipate trends, reduce risk, and plan strategically.
Ready to Elevate Your Business Intelligence & Reporting Capabilities?
Prodware helps you design, deploy, and optimize modern BI and reporting solutions that turn your data into actionable insights and drive smarter decision-making.
Turn fragmented data into actionable insights in minutes, not days. BI & reporting remove manual work, enabling faster data-driven decisions.
Automating reporting reduces manual data work cuts errors and rework boosts efficiency and frees talent for higher value growth tasks.
As businesses grow, reporting scales with data and sources. BI supports that growth without proportional time or cost, ensuring visibility and continuous tracking.
Business Intelligence & Reporting solutions connect to a wide range of data sources, including databases (SQL/NoSQL), cloud platforms, ERP/CRM systems, APIs, spreadsheets, and data lakes. They support both real-time streaming and batch ingestion. Built-in connectors and ETL/ELT pipelines allow automated data extraction, transformation, and loading. This ensures that data from disparate systems is unified into a consistent structure for analysis and reporting.
The solution provides a structured data modeling layer that transforms raw data into business-friendly models. It defines relationships, hierarchies, calculated fields, and standardized metrics (KPIs). A semantic layer ensures that business users interact with consistent definitions of data across all reports and dashboards. This reduces ambiguity, improves data governance, and enables reusable logic across multiple reporting use cases and departments.
BI platforms include dynamic dashboards with interactive charts, graphs, maps, and tables. Users can filter, drill down, slice, and pivot data in real time to explore insights at different levels of granularity. Visual components are customizable and support advanced visualization types such as heatmaps, waterfall charts, and trend analysis. Dashboards are designed for both operational monitoring and strategic decision-making across roles.
Users can create, modify, and run reports without relying on technical teams. Drag-and-drop interfaces enable business users to build queries, define metrics, and generate reports on demand. This self-service capability reduces dependency on IT, accelerates insights delivery, and empowers departments to explore data independently. Reports can be scheduled, exported, and shared in multiple formats such as PDF, Excel, or web-based views.
BI solutions include robust governance features such as role-based access control, row-level security, and data masking. They ensure that users only access authorized data based on their role or department. Audit trails track report usage and data access. Metadata management and data lineage tracking provide transparency on how data flows and transforms, ensuring compliance with regulatory and organizational policies.
The platform supports advanced analytical capabilities such as trend analysis, forecasting, statistical functions, and KPI calculations. Users can apply custom formulas, time intelligence (year-over-year, month-to-date), and predictive models. Integration with machine learning models or embedded analytics engines enables deeper insights beyond descriptive reporting. This allows organizations to move from historical reporting to predictive and prescriptive analysis.
Automated report generation and distribution ensure stakeholders receive timely insights. Reports can be scheduled to run at specific intervals (daily, weekly, monthly) and delivered via email, dashboards, or shared portals. Dynamic filtering allows personalized report outputs per recipient. Version control and archiving ensure historical reports are stored for comparison and compliance purposes, improving operational efficiency and communication.
We deliver tailored, high-impact solutions across diverse industries, helping businesses innovate, grow, and achieve operational excellence.
Discover how Baril Coatings modernized operations with a cloud ERP, improved data visibility and supported sustainability goals with Prodware
Discover how BÜFA Composites Benelux modernized ERP, scaled operations and supported European growth with Microsoft Business Central.
Discover how CLC Electro Marcilla optimized logistics and partner connectivity with a scalable ERP solution powered by Business Central.
See how Coldec used Microsoft Dynamics 365 Business Central to manage global operations, improve flexibility and secure data.
See how Gräper used Dynamics 365 Field Service and Microsoft 365 to streamline operations, improve data access and scale services.
See how Heliox integrated ERP and CRM with Dynamics 365 to improve supply chain, sales and service performance globally.
Business Intelligence refers to the processes, tools, and technologies used to collect, analyze, and visualize business data. It helps organizations turn raw data into actionable insights for better decision-making.
BI tools can generate a wide range of reports, including sales performance dashboards, financial summaries, operational efficiency reports, customer behavior analysis, and real-time KPI tracking dashboards.
Reporting in BI provides accurate, timely, and visualized data insights that help decision-makers identify trends, detect problems early, measure performance, and make data-driven strategic decisions.
Prodware brings 35+ years of digital transformation expertise and deep Microsoft specialization to help organizations design, deploy, and govern Business Intelligence & Reporting at scale. Our unified approach combines modern data platforms, semantic modeling, interactive dashboards, enterprise reporting, data governance, data readiness, and change management into one cohesive framework—enabling trusted insights, operational excellence, and measurable business impact.
Tell us about your project and we’ll show you how Prodware can transform your business.